Riskmaps for West-Nil-Virus in Cities
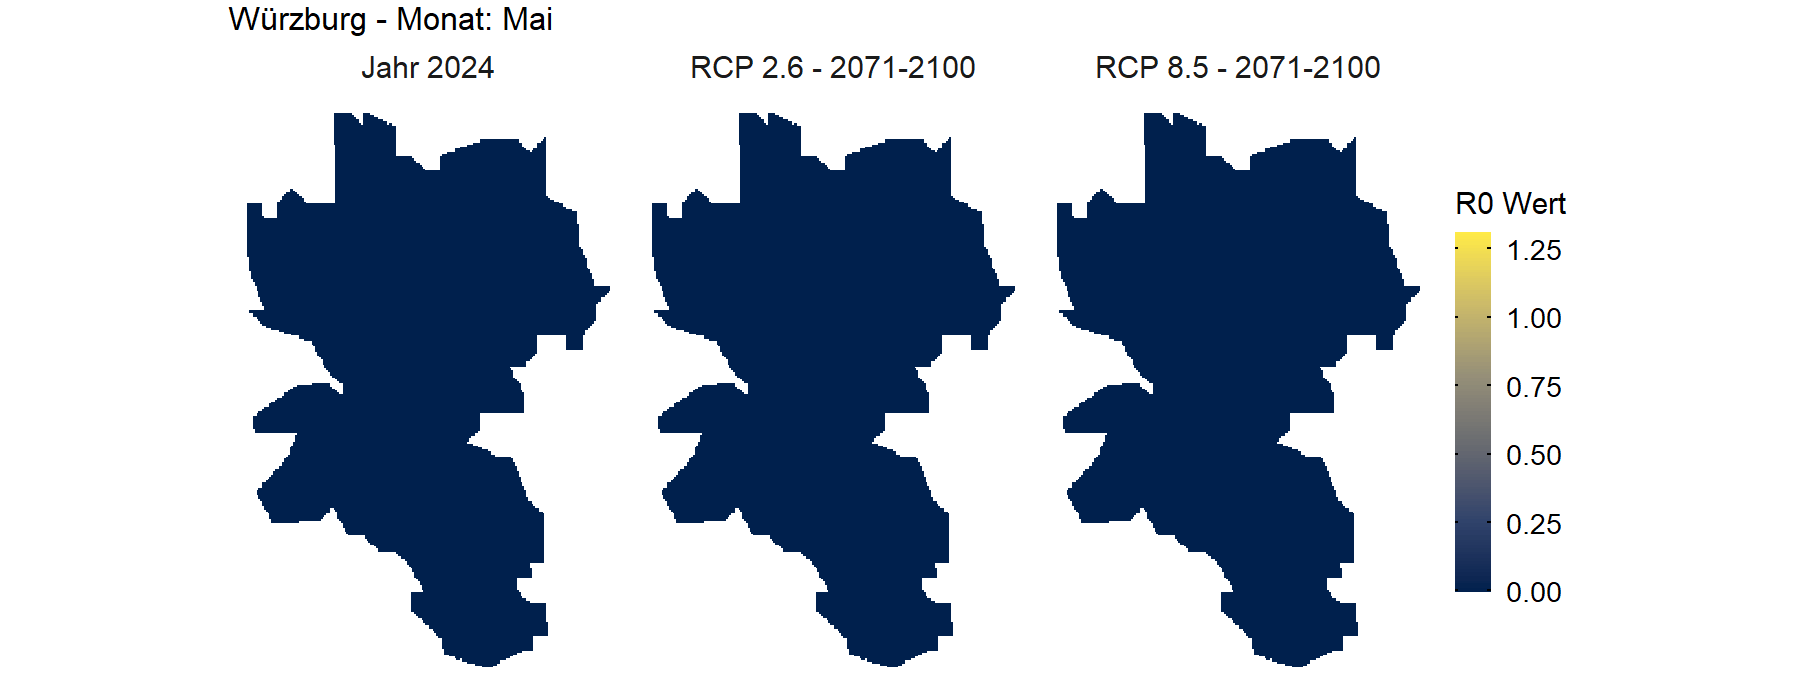
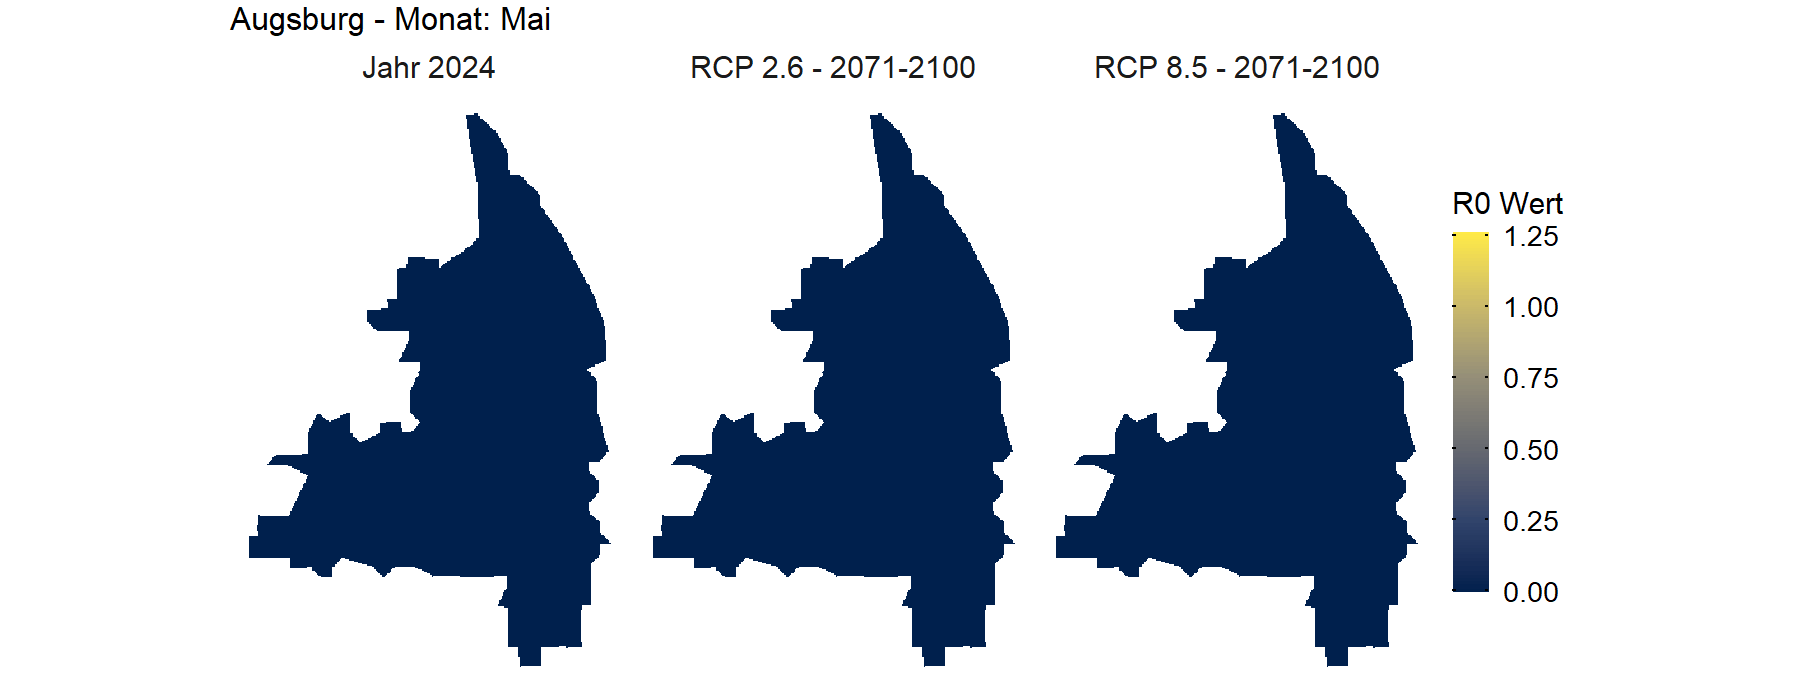
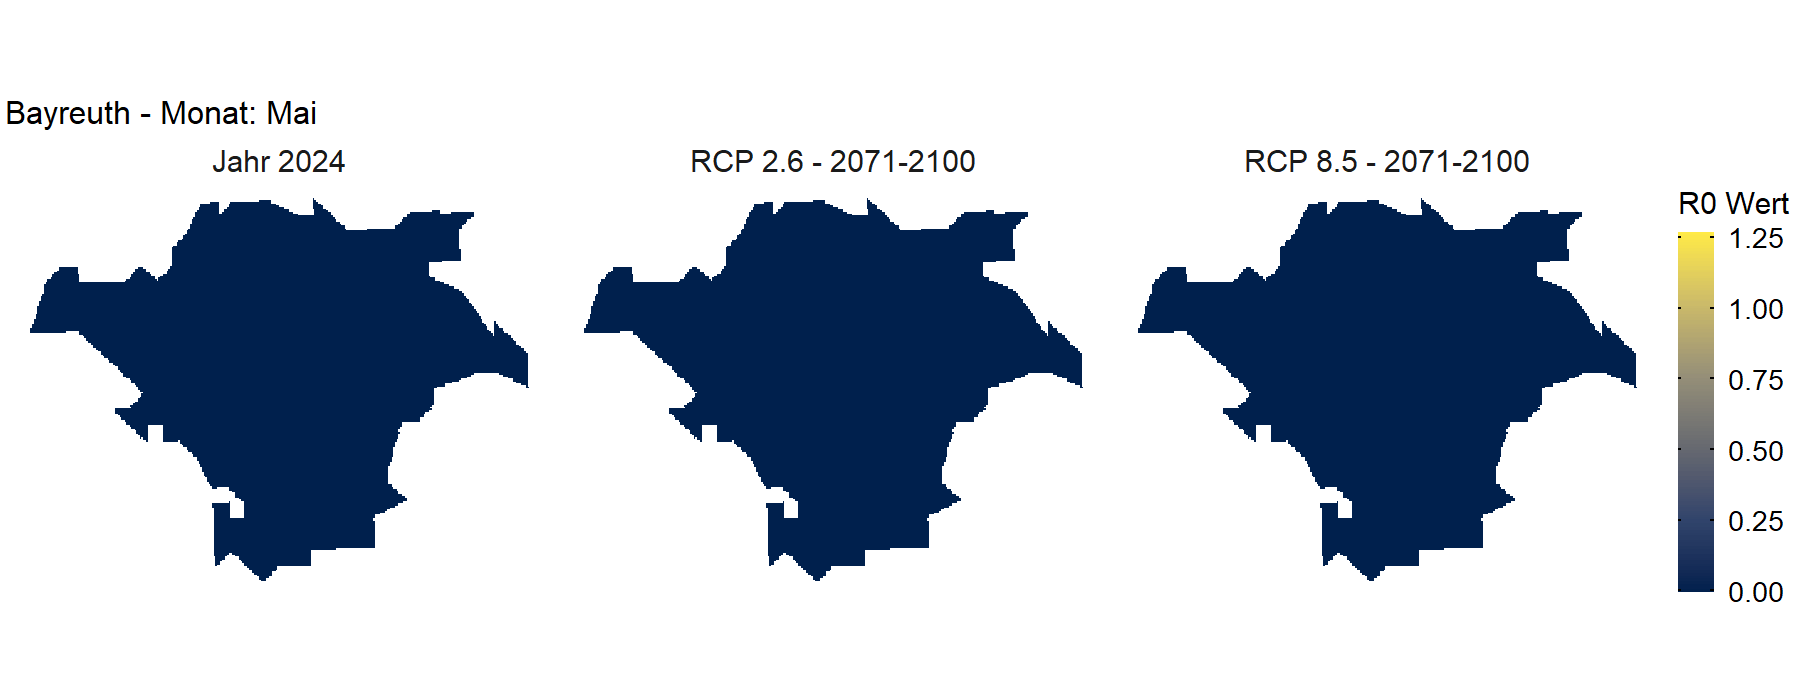
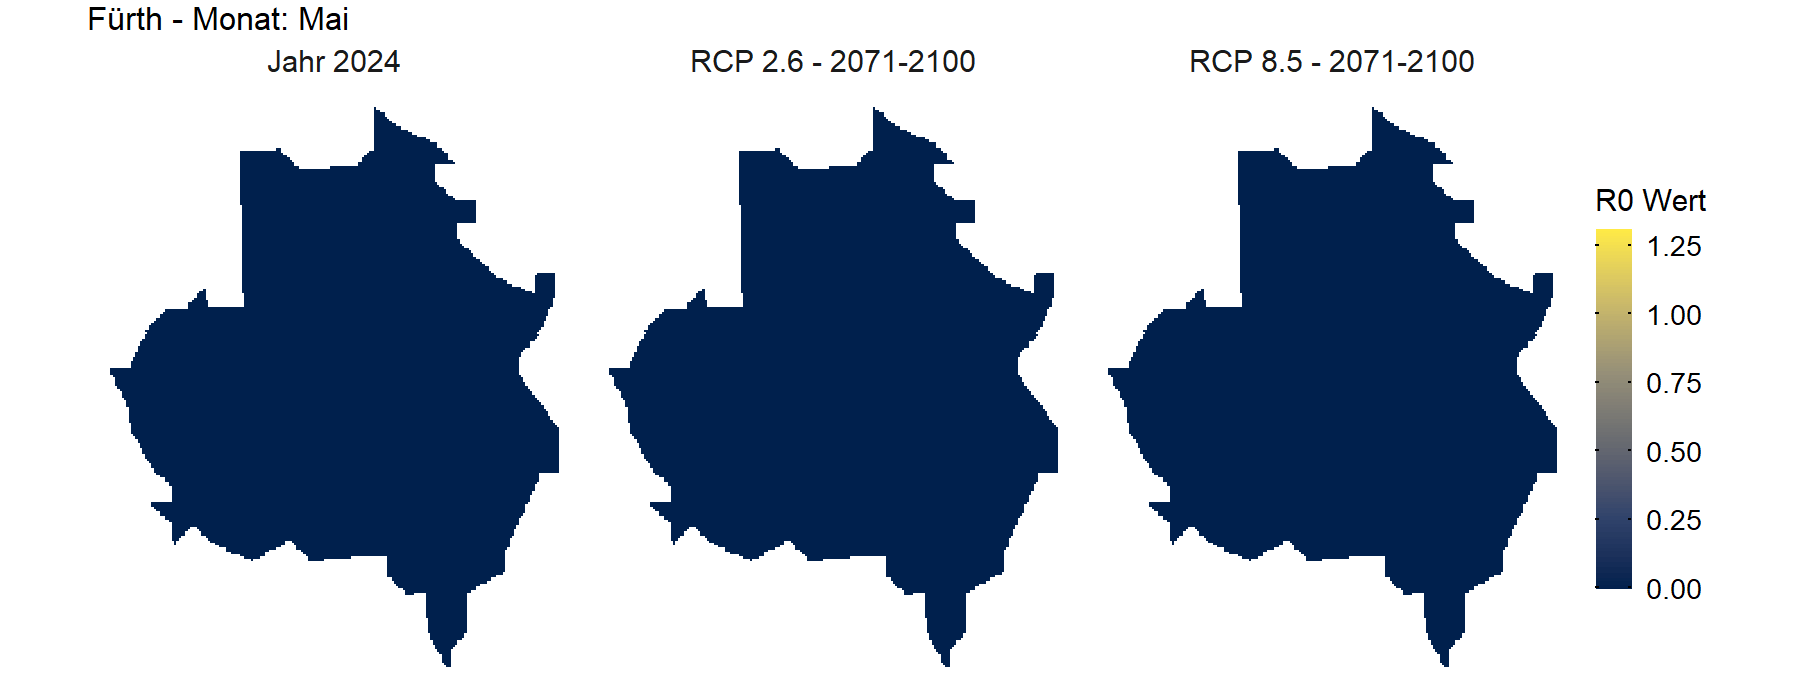
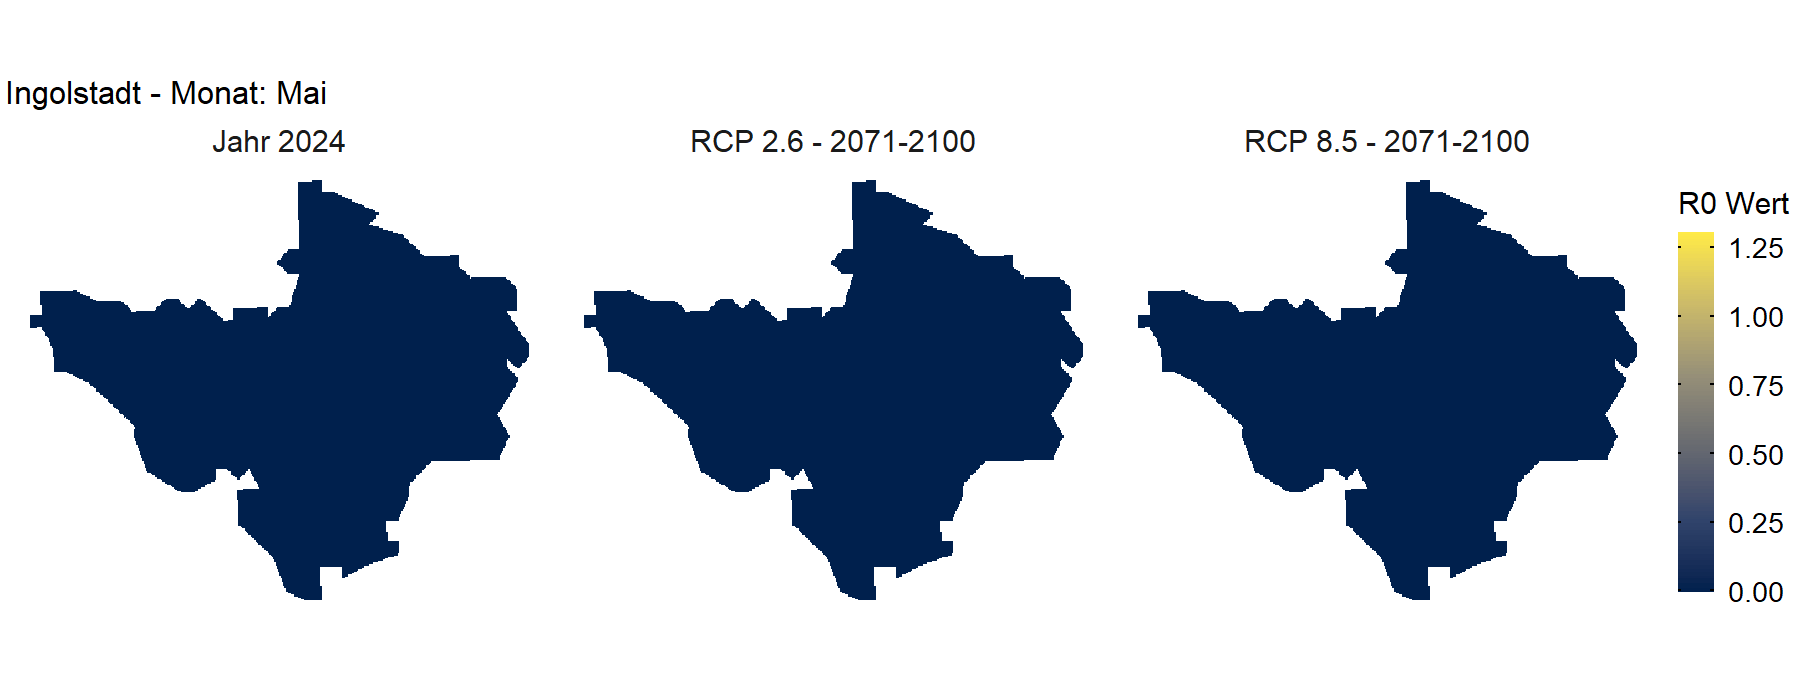
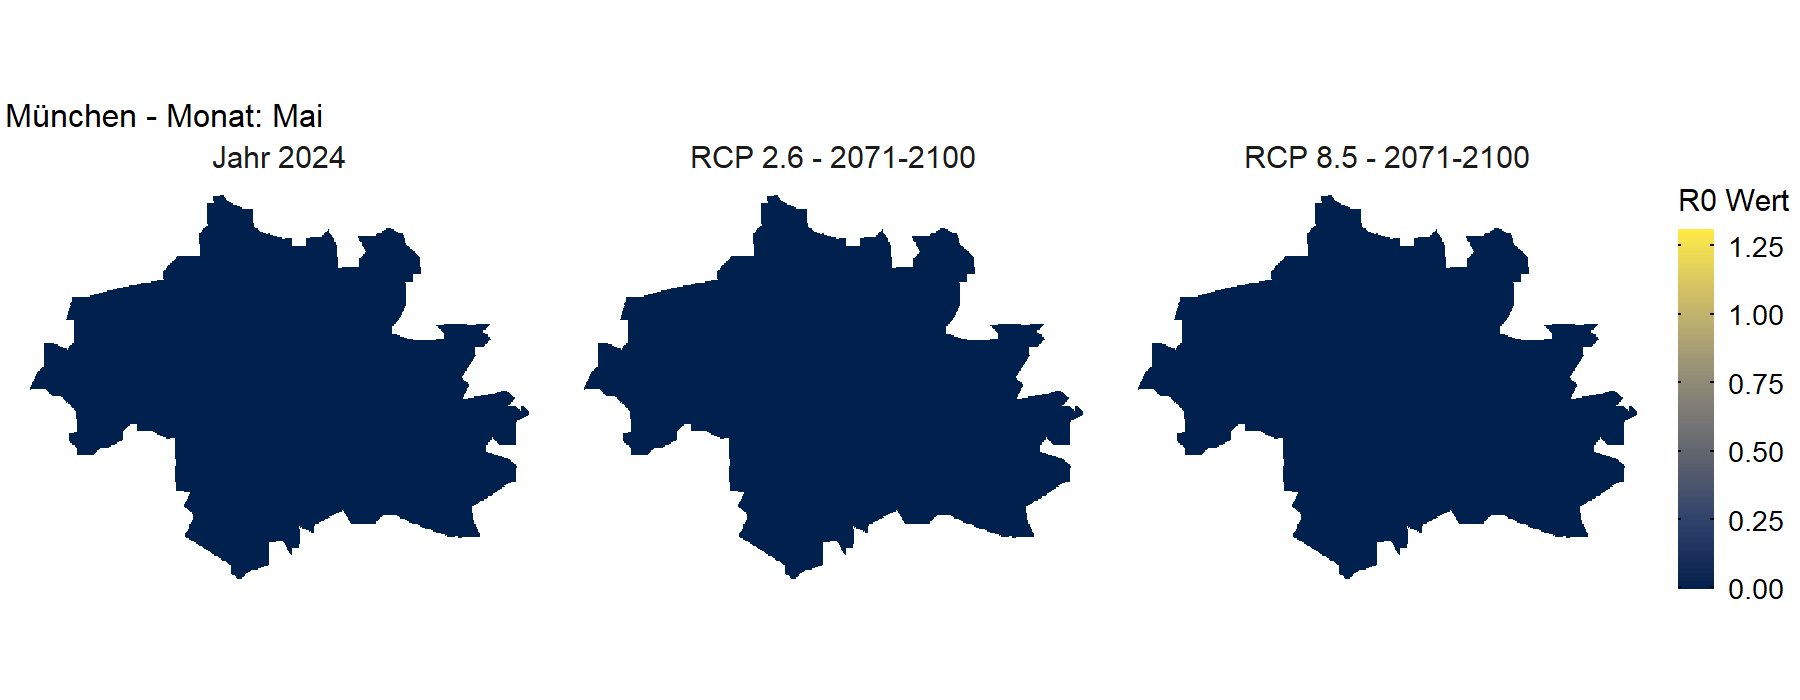
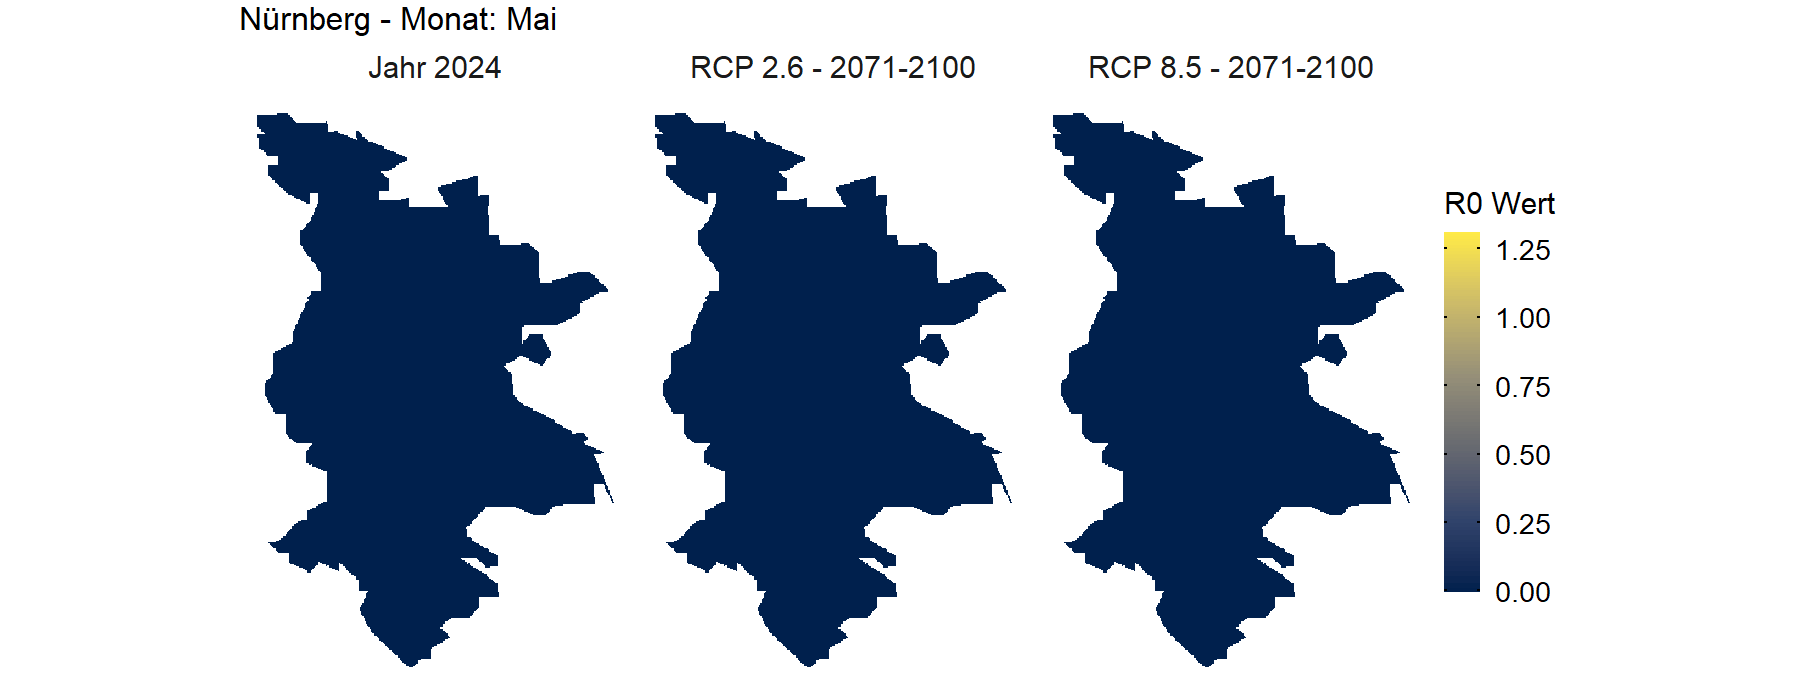
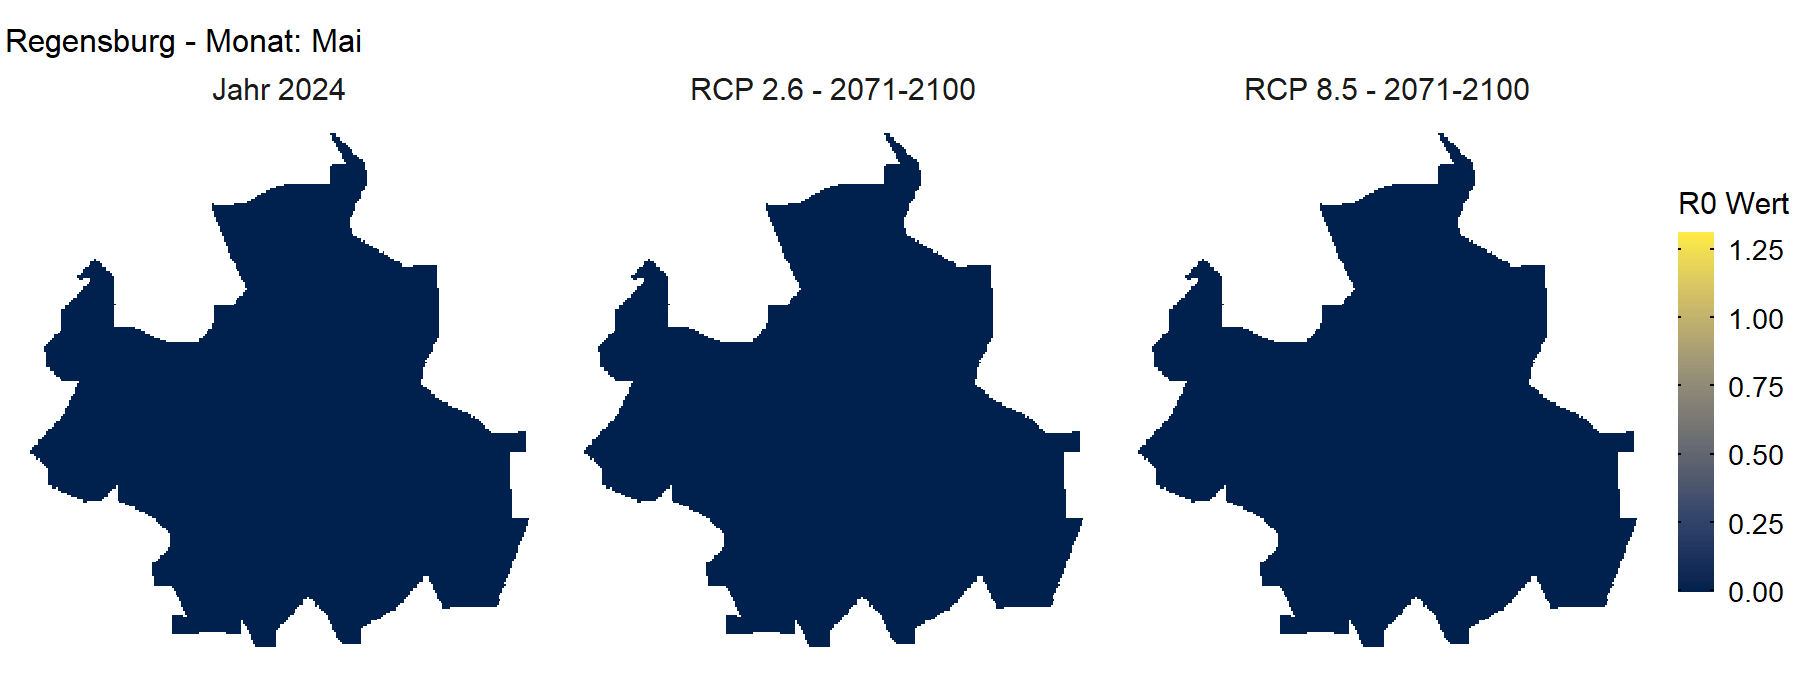
The following maps show the average R0 values for August to October in the respective cities. The animations consist of three individual maps. The first map shows the risk of infection with the West-Nile-Virus in 2024, the second map shows the projected risk of infection for 2071-2100 under the RCP 2.6 climate scenario, and the third map also shows the risk of infection for 2071-2100, but with climate developments assuming the RCP 8.5 scenario.
The RCP (Representative Concentration Pathways) scenarios describe different anthropogenic greenhouse gas concentrations. RCP 2.6 is a very optimistic approach, in which radiative forcing in 2100 is increased by 2.6 W/m² compared to pre-industrial times in 1850. This would correspond to a global temperature increase of approximately 1.5 to a maximum of 2.0 °C. The RCP 8.5 scenario, on the other hand, is the most pessimistic, “worst-case” (but also “business as usual”) scenario, in which an average global temperature increase of approximately 5 °C is expected by 2100.
The risk maps were created using a specially developed epidemiological model with the help of high-resolution temperature data.
- Augsburg
-
- BayreuthEinkl
-
- Fürth
-
- Ingolstadt
-
- München
-
- Nürnberg
-
- Regensburg
-
- Würzburg
-